Introduction
Sometime in the report you might wanted some extra information or further analysis from the report itself but you not able to select in the report design. So you had to self query to get the extra information or further analysis.
Example 1 - Show GST Summary at Last Page
Below is Example doing following actions
- Get data information (Tax, Tax rate, LocalAmount, LocalTaxAmt)
- Group the data by Tax code
Last Script Update : 18 Nov 2015
Steps
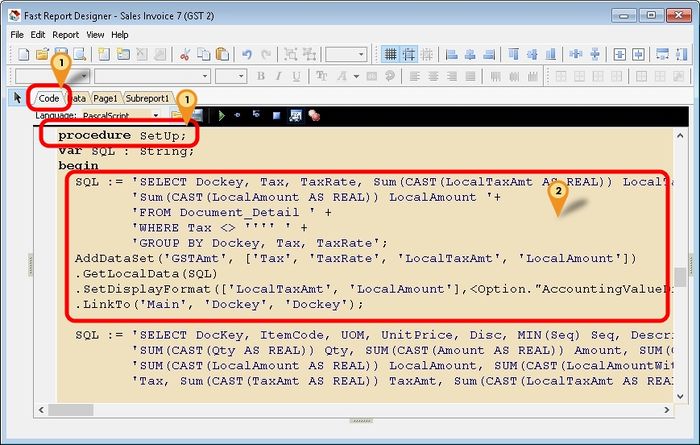
- 01. Click Code tab & scroll down look for procedure SetUp
- 02. Copy below script & paste it between the begin & end; in procedure SetUp
  SQL := 'SELECT Dockey, Tax, TaxRate, Sum(CAST(LocalTaxAmt AS REAL)) LocalTaxAmt, ' +
         'Sum(CAST(LocalAmount AS REAL)) LocalAmount '+
         'FROM Document_Detail ' +
         'WHERE Tax <> '''' ' +
         'GROUP BY Dockey, Tax, TaxRate';
  AddDataSet('GSTAmt', ['Tax', 'TaxRate', 'LocalTaxAmt', 'LocalAmount']) // Create New Pipeline (eg here is GSTAmt)
  .GetLocalData(SQL) // Execute the Query
  .SetDisplayFormat(['LocalTaxAmt', 'LocalAmount'],<Option."AccountingValueDisplayFormat">) // Set Display Format
  .LinkTo('Main', 'Dockey', 'Dockey'); // Link the New Pipeline (eg here is to link with Main Pipeline)
- 03. Click File | Save As... to save the file (eg Sales Invoice 7 (GST 2)-New)
- 04. Click File | Exit to exit the report design
- 05. Click Design again in the report designer for the file just save on Steps 3 (eg Sales Invoice 7 (GST 2)-New)
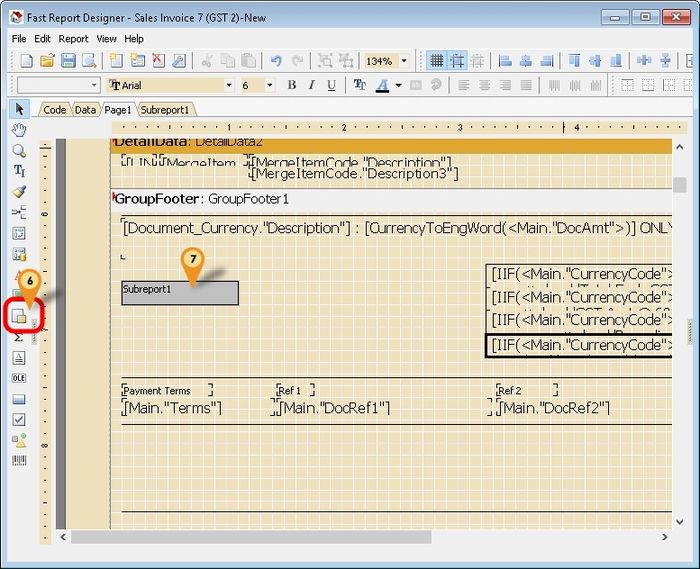
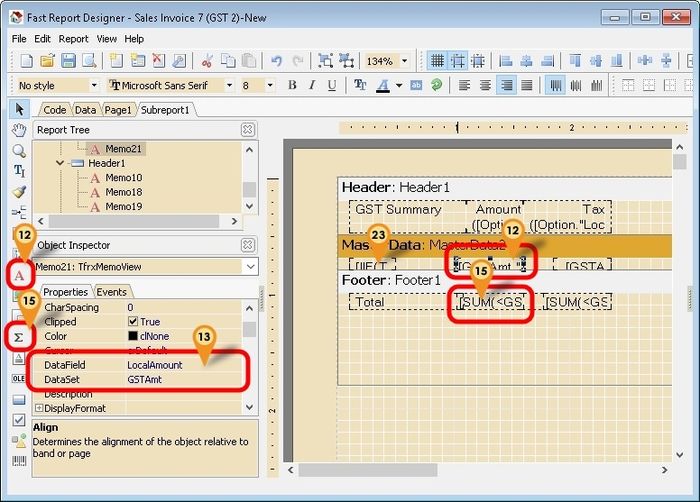
- 06. Click Subreport Icon
- 07. Click the place to print
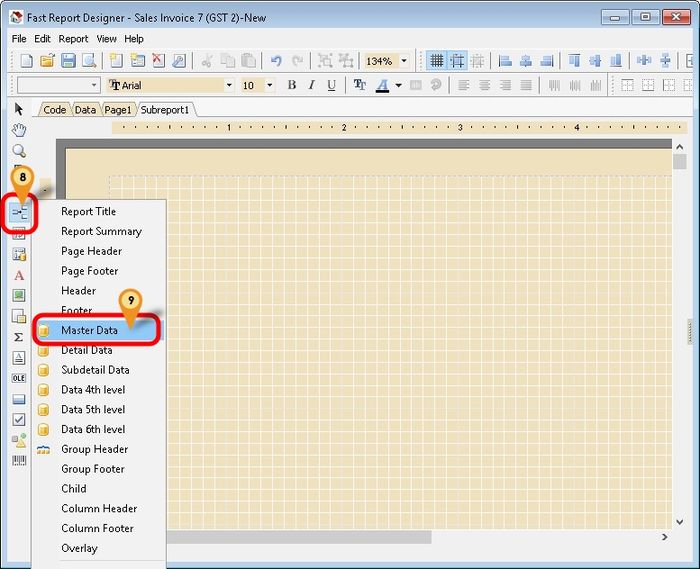
- 08. Click Insert Band icon
- 09. Select Master Data
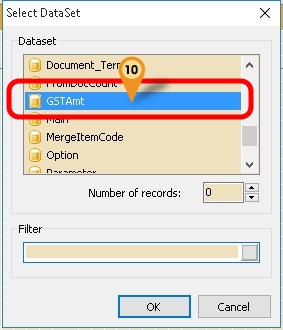
- 10. In the Dataset select the New Pipeline created at Step 2 (eg GSTAmt) & Click Ok
- 11. Repeat Steps 8 to add the Header & Footer
- 12. Click on Red A icon & click the place to print
- 13. Select the option for following setting
- Dataset : GSTAmt
- DataField : LocalAmount
- 14. Repeat Step 12 & 13 for other but DataField change to LocalTaxAmt
- 15. Click Sum Icon & click at the Footer
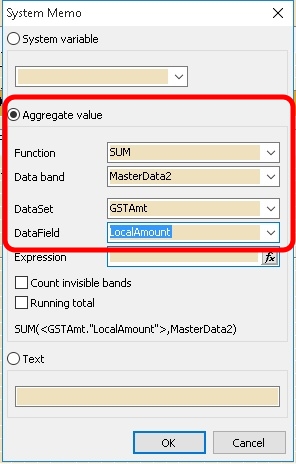
- 16. Select Aggregate value & set the option as following setting
- Function : SUM
- Data band : MasterData2
- DataSet : GSTAmt
- DataField : LocalAmount
- 17. Click Ok
- 18. Repeat Step 16 & 17 for other but DataField change to LocalTaxAmt
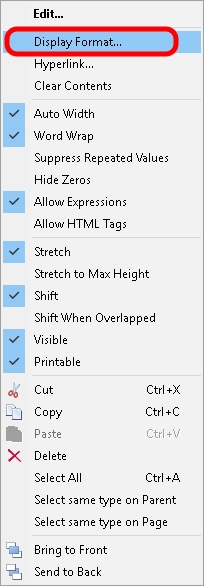
- 19. Right Click & select DisplayFormat
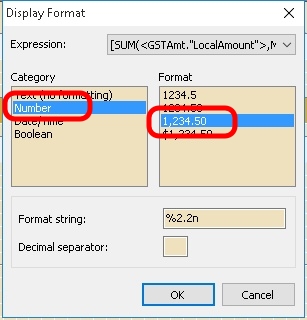
- 20. Set the setting for following option
- Category : Number
- Format : 1,234.50
- 21. Click OK
- 22. Repeat Steps 19 to 21 for other Total field (i.e. LocalTaxAmt)
- 23. Click on Red A icon & click the place to show tax code
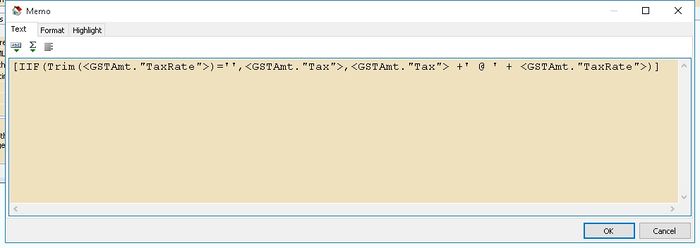
- 24. Copy below script & paste in the memo
[IIF(Trim(<GSTAmt."TaxRate">)='',<GSTAmt."Tax">,<GSTAmt."Tax"> +' @ ' + <GSTAmt."TaxRate">)]
- 25. Click OK.
- 26. For Label, Click on Red A icon, click the place to print & enter the Decription
- 27. Save the report.
Example 2 - Show Show 1st FromDocNo at Header
Below is Example will get FromDocNo Field from the Detail Data
Last Script Update : 19 Sep 2018
Steps
- 01. Click Code tab & scroll down look for procedure SetUp
- 02. Copy below script & paste it between the begin & end; in procedure SetUp
  SQL := 'SELECT Dockey, Min(Seq) Seq, FromDocDate, FromDocNo FROM Document_Detail '+
         'WHERE FromDocType <> '''' ';
  AddDataSet('pl_FromDocInfo', ['Dockey', 'FromDocDate', 'FromDocNo'])
  .GetLocalData(SQL)
  .LinkTo('Main', 'Dockey', 'Dockey');
- 03. Click File | Save As... to save the file (eg Sales Invoice 7 (GST 2)-New)
- 04. Click File | Exit to exit the report design
- 05. Click Design again in the report designer for the file just save on Steps 3 (eg Sales Invoice 7 (GST 2)-New)
- 06. Click on Red A icon & click the place to print
- 07. Select the option for following setting
- Dataset : pl_FromDocInfo
- DataField : FromDocNo
- 08. Repeat Step 6 & 7 for other field
- 09. Save report
Example 3 - Group Overtime in Payslip
Below is Example will group all the Overtime by Code, Description, Rate & PayRate.
Last Script Update : 19 Sep 2018
Steps
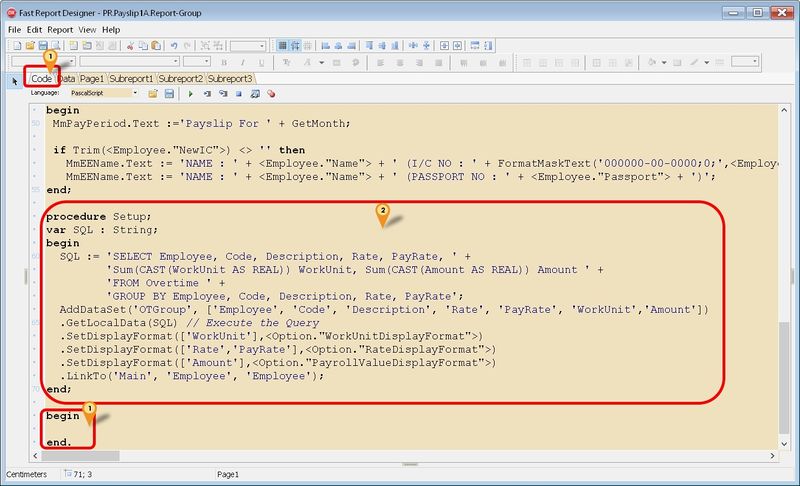
- 01. Click Code tab & scroll look for begin & end.
- 02. Copy below script & paste it above the begin & end.
procedure Setup;
var SQL : String;
begin
  SQL := 'SELECT Employee, Code, Description, Rate, PayRate, ' +
         'Sum(CAST(WorkUnit AS REAL)) WorkUnit, Sum(CAST(Amount AS REAL)) Amount ' +
         'FROM Overtime ' +
         'GROUP BY Employee, Code, Description, Rate, PayRate';
  AddDataSet('OTGroup', ['Employee', 'Code', 'Description', 'Rate', 'PayRate', 'WorkUnit','Amount'])
  .GetLocalData(SQL) // Execute the Query
  .SetDisplayFormat(['WorkUnit'],<Option."WorkUnitDisplayFormat">)
  .SetDisplayFormat(['Rate','PayRate'],<Option."RateDisplayFormat">)
  .SetDisplayFormat(['Amount'],<Option."PayrollValueDisplayFormat">)
  .LinkTo('Main', 'Employee', 'Employee');
end;
- 03. Click File | Save As... to save the file (eg PR.Payslip1A.Report-Group)
- 04. Click File | Exit to exit the report design
- 05. Click Design again in the report designer for the file just save on Steps 3 (eg SPR.Payslip1A.Report-Group)
- 06. Click Subreport3
- 07. Double Click MasterData4
- 08. Change the Dataset to OTGroup & Click OK
- 09. Change all the Field Data Set to OTGroup for all Component in MasterData4
Below Example is to Get total SVE for 6%
Last Script Update : 23 Jul 2024
Steps
- 01. Click Code tab & scroll down look for procedure SetUp
- 02. Copy below script & paste it between the begin & end; in procedure SetUp
  SQL := 'SELECT DocKey, SUM(LocalAmount)*0.06 SVE FROM Document_Detail ' +
         'WHERE Tax=''SVE'' ' +
         'GROUP BY DocKey';
  AddDataSet('pl_TotSVE', ['Dockey', 'SVE'])
  .GetLocalData(SQL)
  .SetDisplayFormat(['SVE'],<Option."AccountingValueDisplayFormat">)
  .LinkTo('Main', 'Dockey', 'Dockey');
- 03. Click File | Save As... to save the file (eg Sales Invoice 8 (SST 2)-New)
- 04. Click File | Exit to exit the report design
- 05. Click Design again in the report designer for the file just save on Steps 3 (eg Sales Invoice 8 (SST 2)-New)
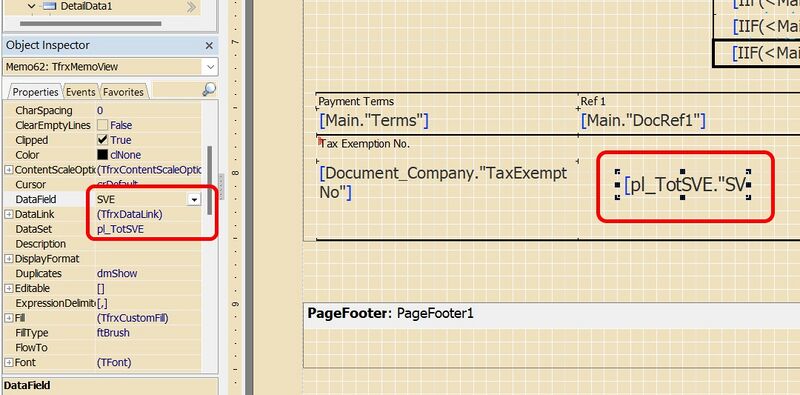
- 06. Click on Red A icon & click the place to print
- 07. Select the option for following setting
- Dataset : pl_TotSVE
- DataField : SVE
- 08. Repeat Step 6 & 7 for other field
- 09. Save report
- Coming Soon...
See also
- Report Designer
- Others Customisation
