Introduction
- To analyse the detail of GST transactions group by tax type. It can be use to check against with GST-03.
GST Listing
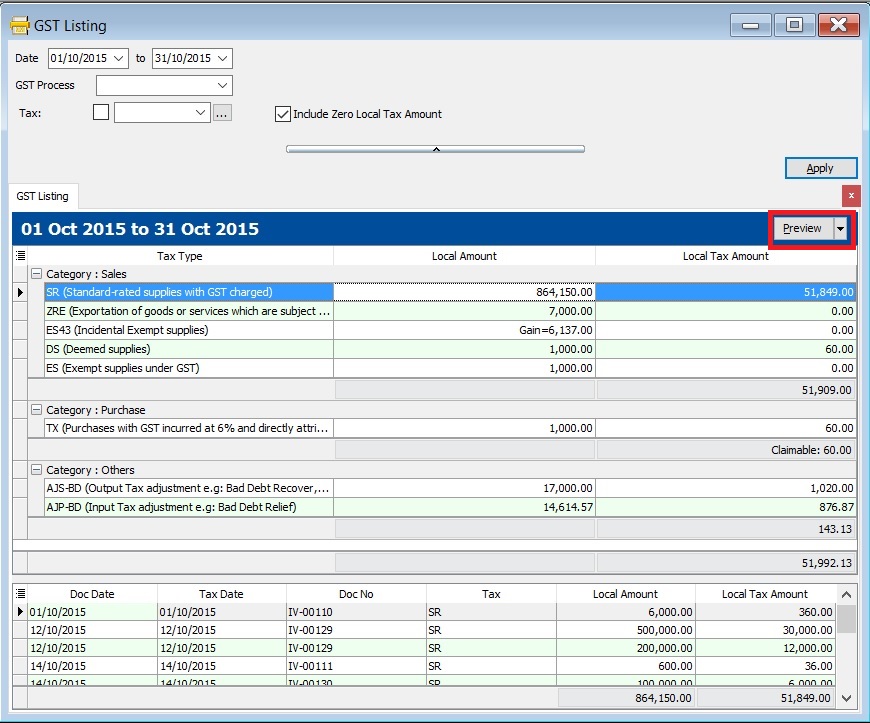
[GST | Print GST Listing...]
GST Listing-Parameter
Parameter Type Explanation Date Date To range the date to retrieve the data after apply it. GST Process Lookup To select the GST Process period. Tax Lookup To select the tax code. Include Zero Local Tax Amount Boolean To show the zero local tax amount.
GST Listing-Main Data
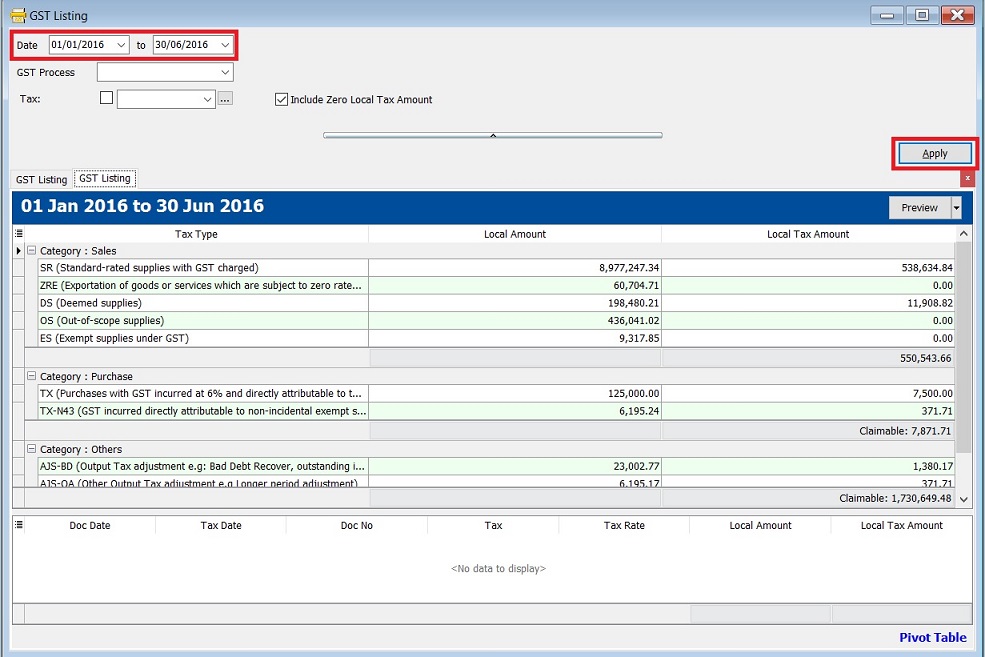
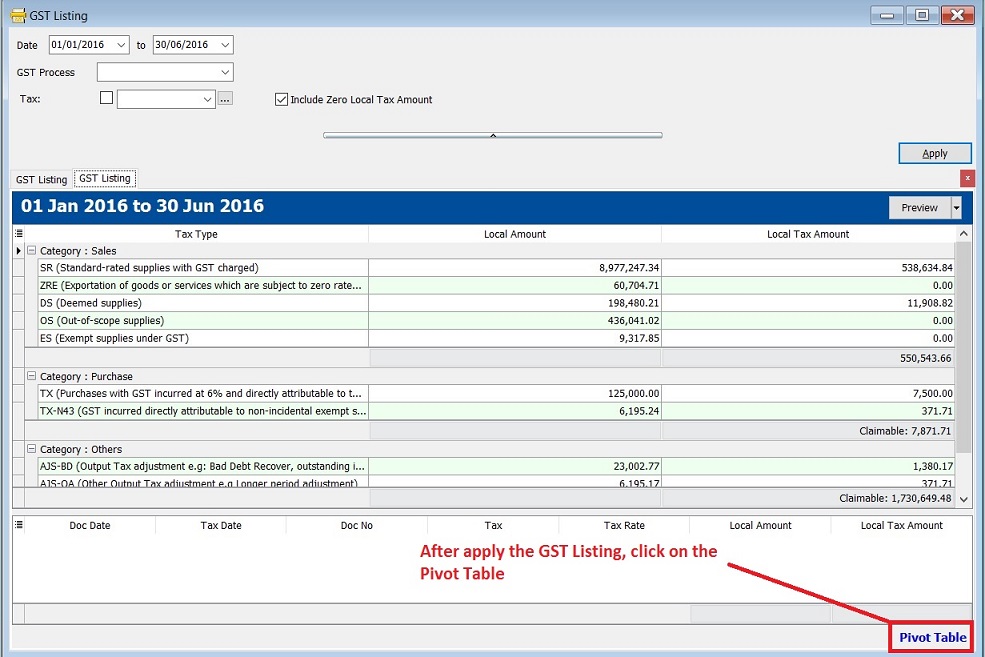
- 1. Select the date range or GST Process
- 2. Select the tax if you would like to get a particular tax code GST listing.
- 3. Click on APPLY.
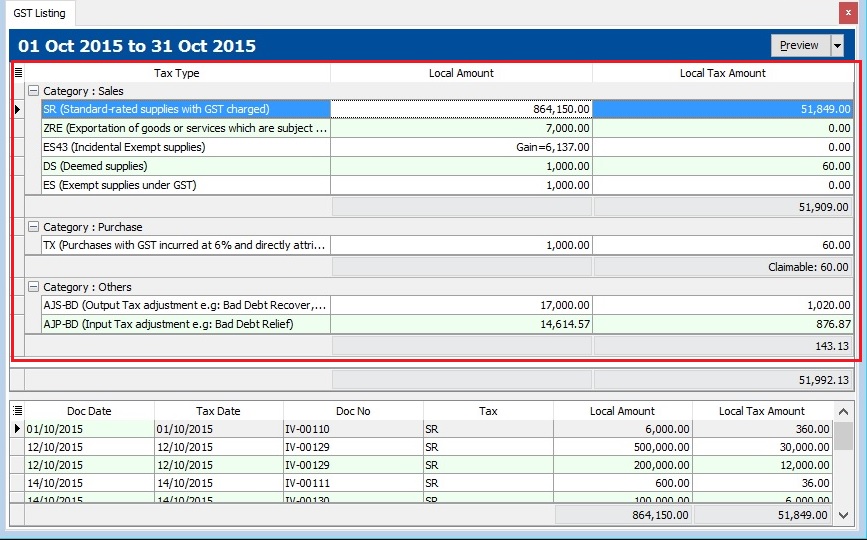
- 4. See the below screenshot.
GST Listing-Detail Data
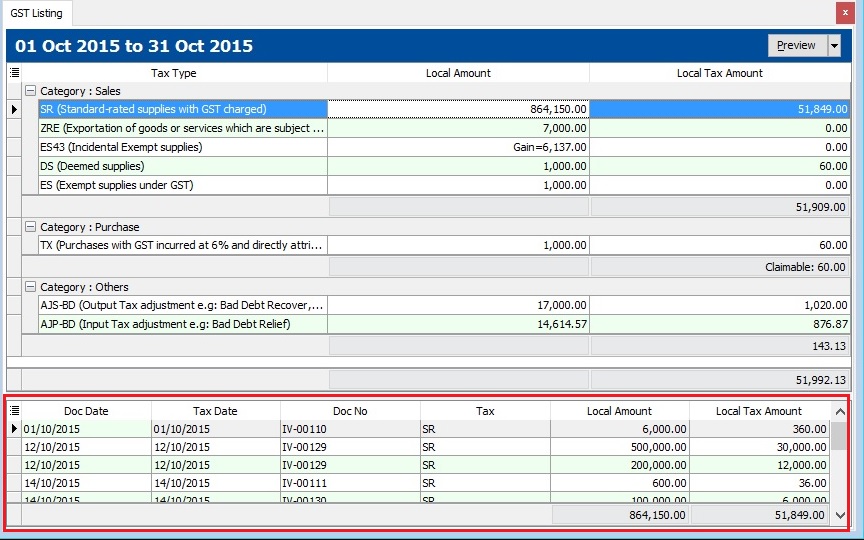
- 1. Point on the Tax Type, eg. SR.
- 2. You can see the breakdown detail in documents level. See the below screenshot.
Reports
No. Report Name Purpoase 01 GST Detail 1 To show the document description in GST Listing. 02 GST Detail 2 To show the document item details description in GST Listing. 03 GST Detail 3 - GST-03 To show the GST-03 details in GST Listing. 04 GST Lampiran 4 - Ringkasan Maklumat Permohanan Tuntutan Pelepasan Hutang Lapuk Lampiran 4 as requested by Kastam Officer 05 GST Lampiran 2 GST form not compulsory to print and submit. It is upon as requested by RMCD. 06 GST Listing - Yearly GST Analysis To analyse the yearly tax amount and taxable amount. 07 GST Summary Sheet - MY GST Summary Sheet format.
NOTE:
From Doc Types in GST Listing Detail are consists of:
1. _A = Unclaimable Non-Incidental Exempt Supplies (TX-N43)
2. _B = Unclaimable TX-RE
3. _C = Annual Adjustment Non-Incidental Exempt Supplies (TX-N43)
4. _D = Annual Adjustment TX-RE
5. _X = Realised Gain Loss
Pivot Table
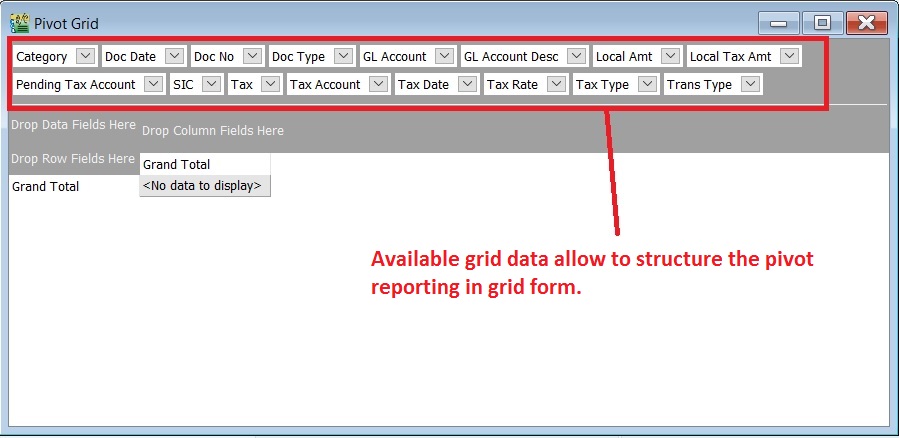
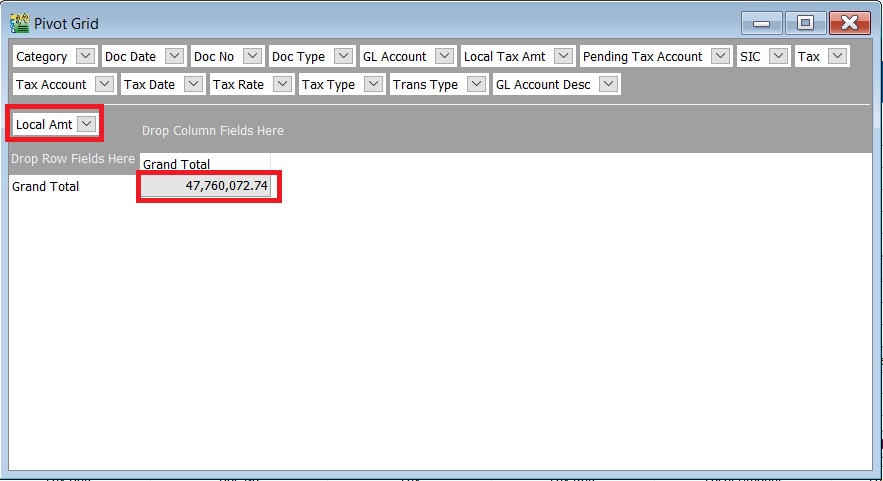
- 3. Pivot Grid. Available grid data to be use to structure the pivot reporting. See the screenshot below.
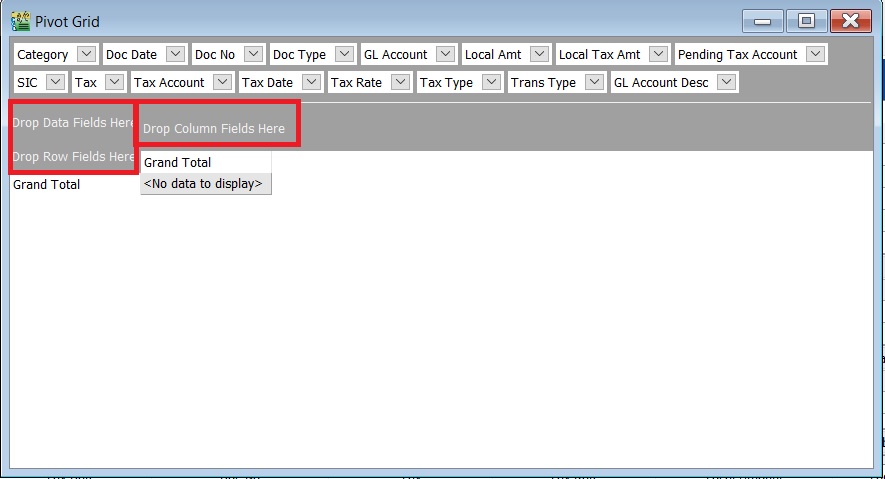
:4. At the Pivot Grid, there are 3 sections:
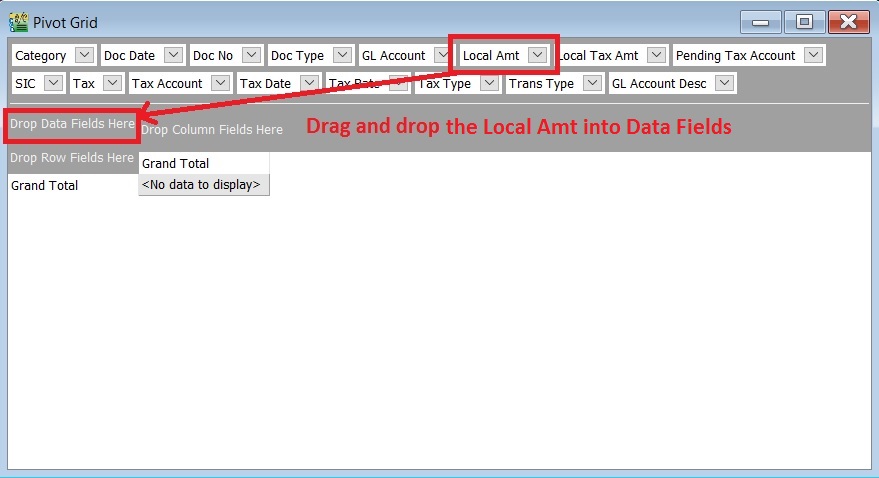
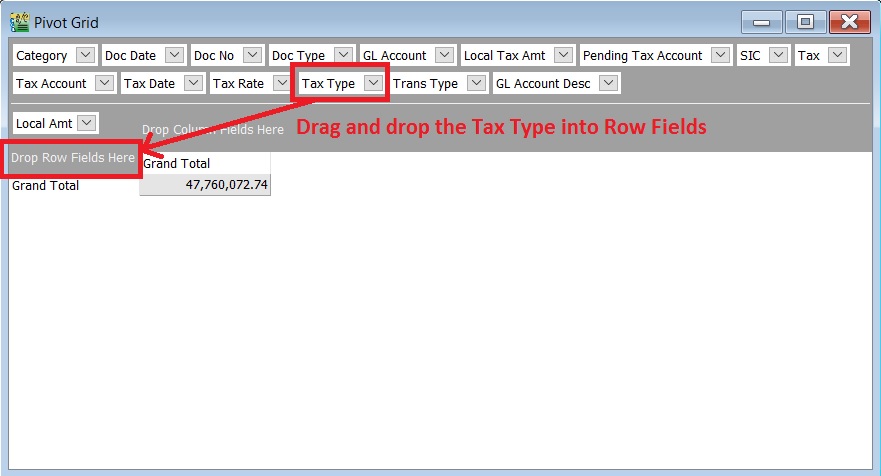
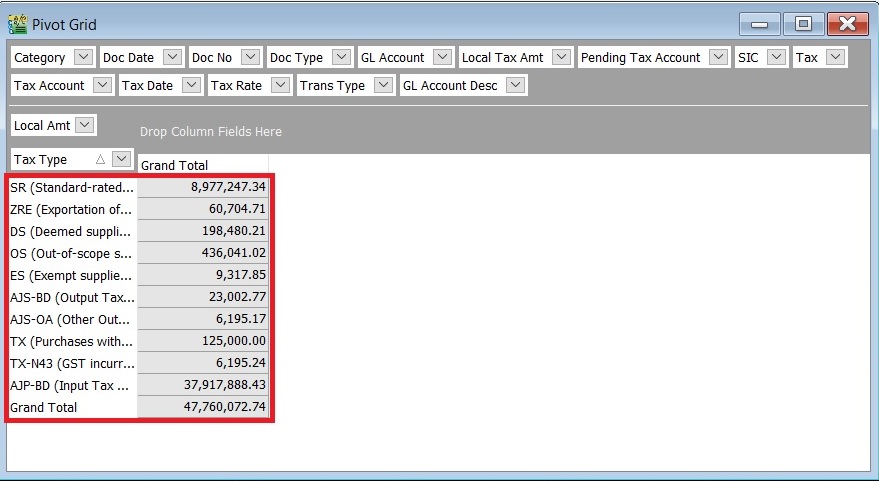
- 8. Tax Type will be display on the row and the Local Amt will be sum according to the Tax Type. See the screenshot below.
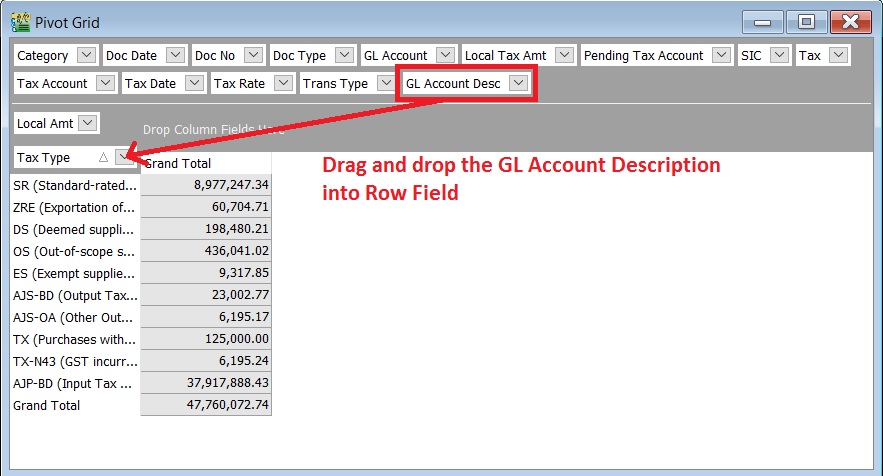
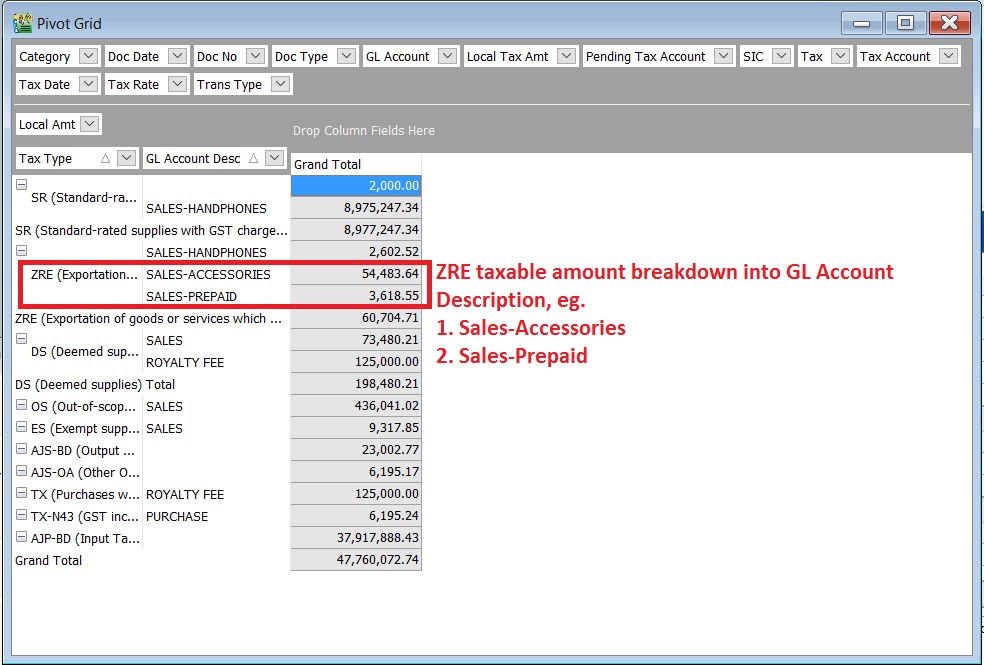
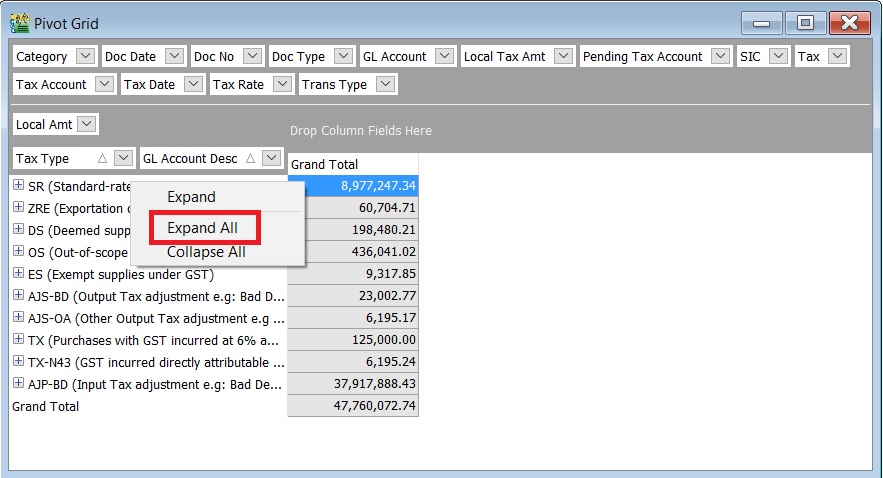
- 9. 2nd Grouping at row', drag and drop the GL Account Desc into the Row Fields to add into second grouping after the tax type.
- 10. GL Account Desc will be display on the row and the Local Amt will be sum according to the Tax Type and GL Account Desc. See the screenshot below.
TIPS:
You right click on the row field to Expand All.
::
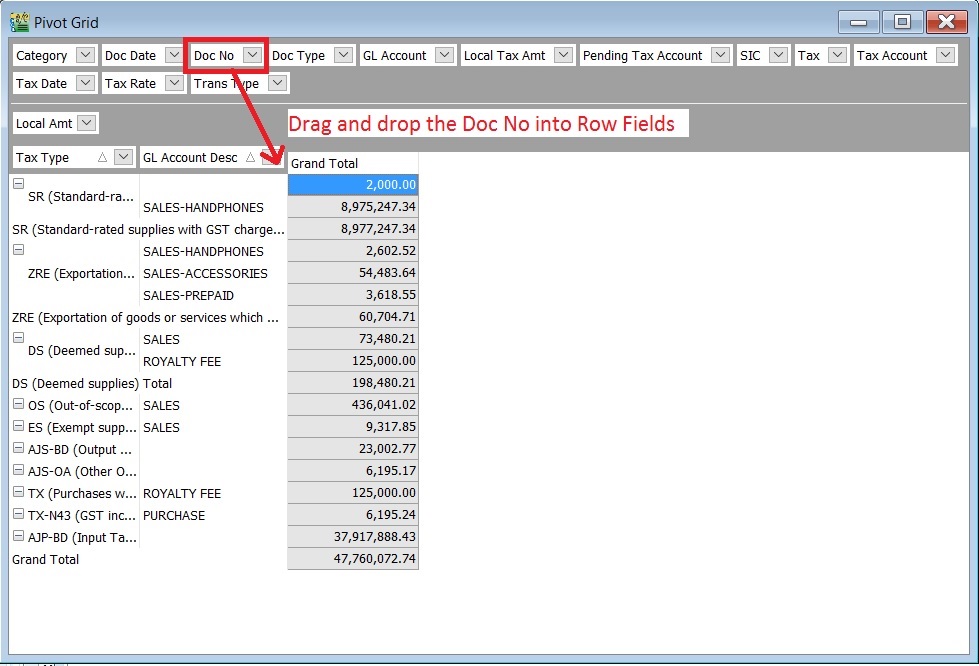
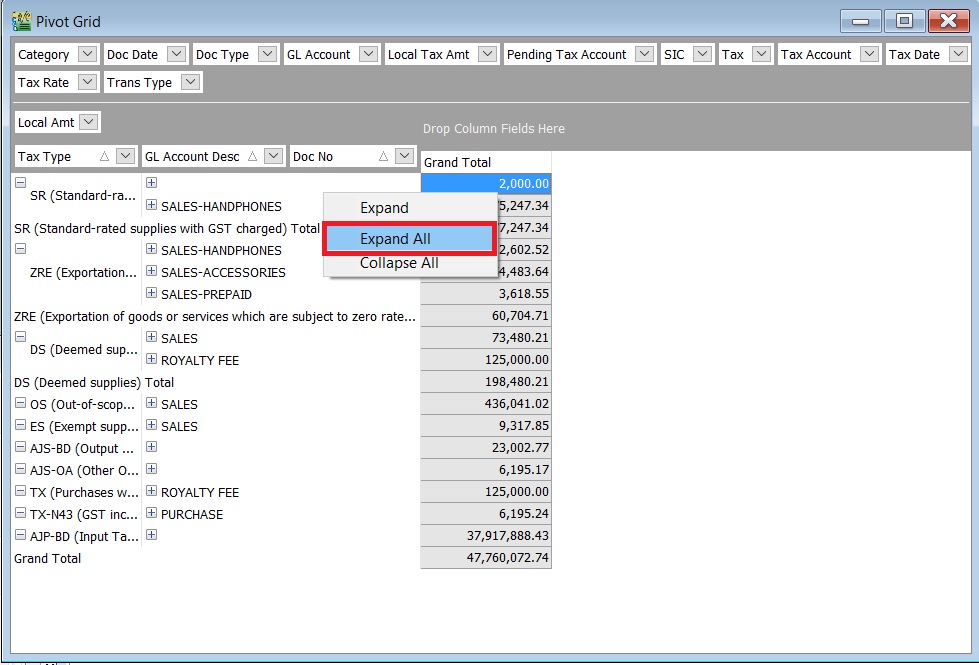
- 11. 3rd Grouping at row', drag and drop the Doc No into the Row Fields to add into third grouping after the Tax Type and GL Account Description.
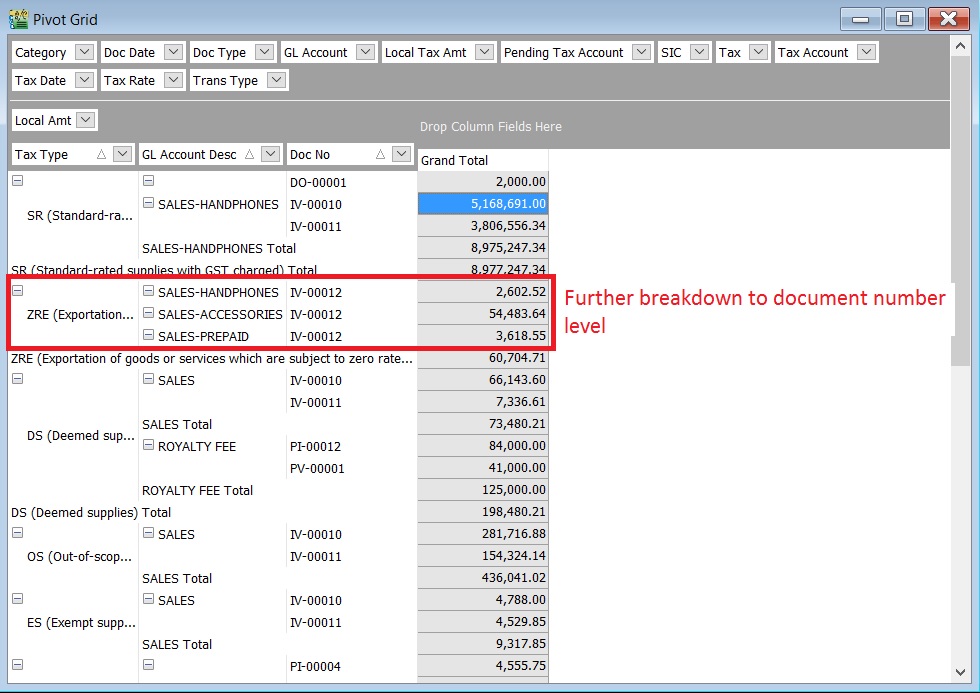
- 12. Doc No will be display on the row and the Local Amt will be sum according to the Tax Type, GL Account Desc and Doc No. See the screenshot below.
TIPS:
You right click on the row field to Expand All.
::
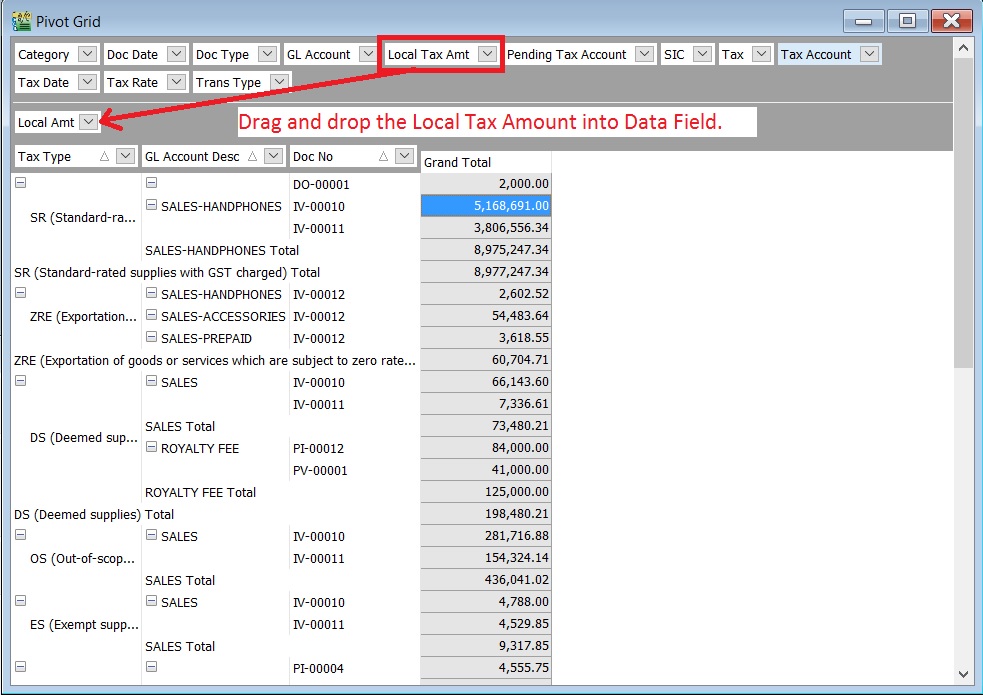
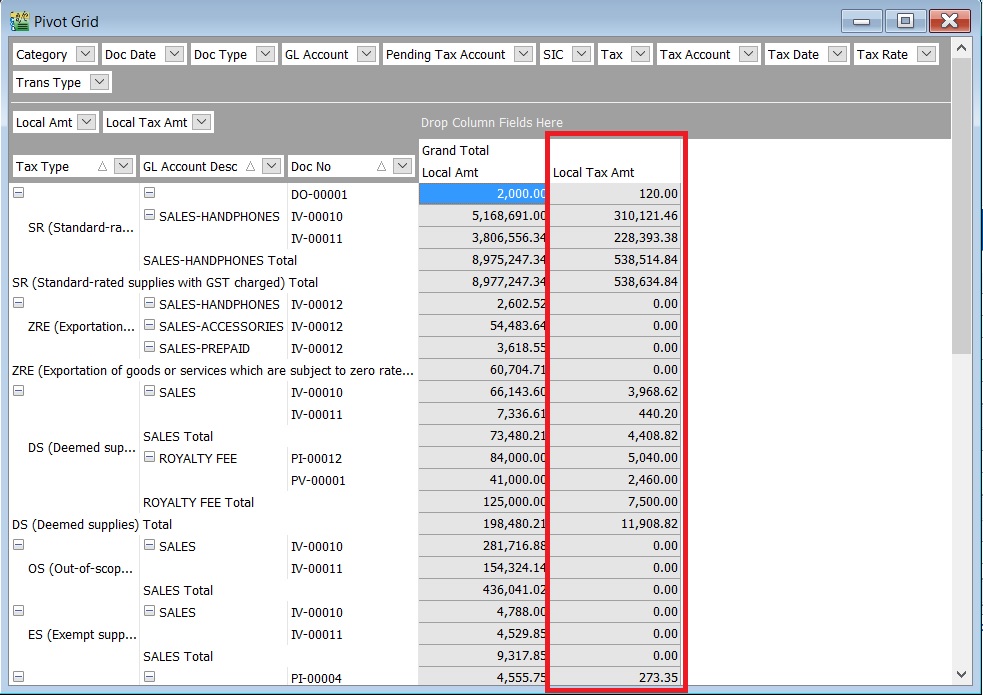
- 13. If you want to show the breakdown for Local Tax Amount by the multiple grouping at row.
- 14. Just drag and drop the Local Tax Amt' into the Data Fields.
