No edit summary |
|||
| Line 13: | Line 13: | ||
<br /> | <br /> | ||
:3. Click on View | Show Chart. | :3. Click on View | Show Chart. | ||
:4. 3 different chart | :4. 3 different chart types '''(Bar Chart, Line Chart, Pie Chart)''' will be prompted. Seet the screenshot below. | ||
::[[File:View-Show Chart-02.jpg|700px]] | ::[[File:View-Show Chart-02.jpg|700px]] | ||
<br /> | <br /> | ||
Latest revision as of 02:09, 2 March 2016
View | Show Chart
Introduction
This function is enable to view the sales/purchase price history data in chart form.
Shortcut Key
- no shortcut.
Show Chart
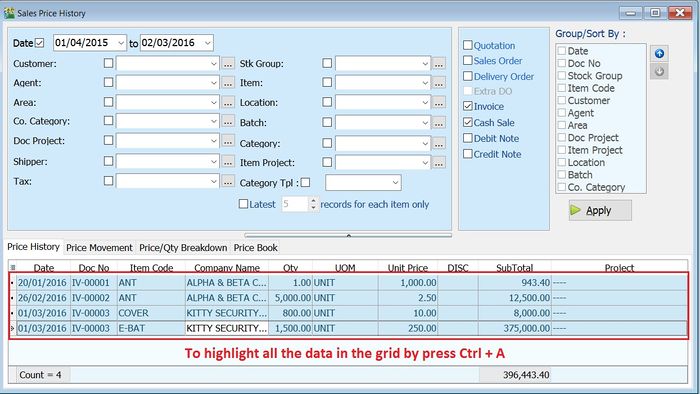
- 1. Apply the Sales / Purchase Price History from Sales | Print Sales Price History or Purchase | Print Purchase Price History .
- 2. Highlight the data in the grids.
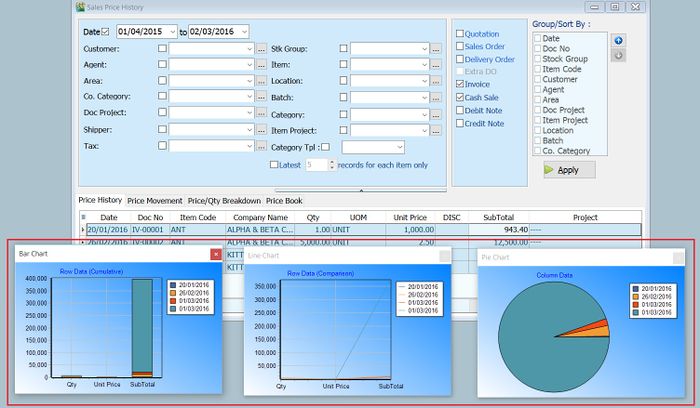
- 3. Click on View | Show Chart.
- 4. 3 different chart types (Bar Chart, Line Chart, Pie Chart) will be prompted. Seet the screenshot below.
- ----------------------------------------------------------------------------------------------------------------------------------------------------
- ----------------------------------------------------------------------------------------------------------------------------------------------------


